Difference between revisions of "DMS Maps"
| Line 71: | Line 71: | ||
'''District of Residence''' - Student's district of residence. | '''District of Residence''' - Student's district of residence. | ||
| − | '''Absences''' - | + | '''Absences''' - Date of student's absences. If student has more than one absence within the date range it will show all dates. This will only show if '''Show Absences''' is checked in the settings box. |
To find definitions of commonly used column headers, follow this link: [[Common Column Headers]]. | To find definitions of commonly used column headers, follow this link: [[Common Column Headers]]. | ||
Revision as of 12:08, 26 April 2024
This program will display a heat map based on options selected for Student's Attendance, Attendance Zone, Test Scores, Grades, GPA, Discipline. A heat map is a graphical representation of data where the individual values contained in a matrix are represented as colors. This map will show where the students reside.
Security: In User Management, the user will need a "Category" of SIS/Maintenance and the "Program" will be DMS Mapping - RW.
Menu Location
System > Trends > DMS Maps
Top
Listed below are each of the Setup Options for each sub-menu.

- The map will appear and can be viewed in a Street Map or Satellite layout.
- The user will first select a sub-menu from the Options drop down located in the top right corner of the page.
- To see the Zones, go to Options -> Attendance Zones and pick the zones you want to view as previously drawn in the DMS System.
- The user will choose the criteria in the various setup boxes as shown above. Ex: Students, Attendance, Test Scores, Grades, etc.
- Then the results will display with heat spots. For each additional criteria set will result in a different color, starting with purple, then gold, then blue, then red, then aqua, then amber, then green, then fuchsia, then magenta, in that order.
- To view a list of students in a specific area of heat spots, use the icons
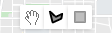 located on the top of the screen, drawing a polygon or rectangle around the desired heat spots. Some users prefer the polygon over the square for pinpointing more oddly shaped heat spots. And the hand icon will move around the map to find additional heat spots.
 - Once that has been done, a list of students will display with student information.
- In the Students list, to show more student's information hover over the student's name to access the iGEAR. For more information about the iGEAR follow this link: Using the iGear.

Column Headers
Year - School year
School - Student's school of enrollment
Zone School - Current zone school based on attendance zone
Last Name - Student's last name
First Name - Student's first name
Middle Name - Student's middle name
Suffix - Student's generational suffix
SIDNO - Student ID number
Grade - Student Grade
Physical Address 1 - Student's physical address line 1
Physical Address 2 - Student's physical address line 2
Physical City - Student's physical city
Physical State - Student's physical state
Physical Zip - Student's physical zip
Parent Phone - Student's home phone number Note that for the Parent Phone column, to gather the parent phone number logic, the default will be the Student Home Phone, Guardian Home, then Father Home, then Mother Home.
Morning Bus - Student's morning bus number
Morning Stop - Student's morning bus stop
Evening Bus - Student's evening bus number
Evening Stop - Student's evening bus stop
OOZ - Student's Out of Zone code
Exceptionality - Student's exceptionality.
District of Residence - Student's district of residence.
Absences - Date of student's absences. If student has more than one absence within the date range it will show all dates. This will only show if Show Absences is checked in the settings box.
To find definitions of commonly used column headers, follow this link: Common Column Headers.
Students
Students will display heat spots representing dwelling population on the map based on the setup criteria and the student`s physical address.

Year - Defaults to the current year. A prior year may be accessed by clicking in the field and making the appropriate selection from the drop down list.
District - Default value is based on the user’s security settings. The user will be limited to their district only.
School - Default value is based on the user's security settings. If the user is assigned to a school, the school default value will be their school site code.
Grade - Leave blank or select all to include all grade levels. Otherwise, choose the desired grade level.
Gender - Leave blank or select all to include all genders. Otherwise, choose the desired gender.
Ethnic - Leave blank or select all to include all ethnicities. Otherwise, choose the desired ethnicity.
Special Codes - Leave blank if all special codes are to be included into the report. Otherwise, choose the desired special code.
Program - Leave blank if all program codes are to be included into the report. Otherwise, choose the desired program code.
Clubs - Leave blank if all clubs are to be included into the report. Otherwise, choose the desired club code.
Custom - Leave blank if all custom codes are to be included into the report. Otherwise, choose the desired custom code.
Sports - Leave blank if all sports are to be included into the report. Otherwise, choose the desired sport code.
Entry Code - Student's entry code into the school that will display on the map.
Leave Code - Student's leave code from the school that will display on the map.
Bus - Select a bus(s) number to filter those students on the map.
Trans Codes - A description for the listings from 01-12 listing the codes for the corresponding numbers to display on the map.
OOZ Code - Leave the field blank if all OOZ Codes are to be included. Otherwise, click in the field to the right of OOZ to select the desired code to be included. Click OK to move back to the main setup screen.
Lunch Code - Select from LU1, LU2, LU3 or LU4 to filter by. Leave the field bland if not filtering by Lunch Codes.
Active Only - This choice will list only those students who are actively enrolled as of the date selected in the date field.
As of Date - This choice will list only those students who are actively enrolled as of the date selected in the date field.
Sped:
All - Select to view all students.
Sped Only - Select to view only Sped students.
Non Sped - Select to view only non Sped students.
504:
All - Select to view all students.
504 Only - Select to view only 504 students.
Non 504 - Select to view only non 504 students.
LEP:
All - Select to view all students.
LEP Only - Select to view only LEP students.
Non LEP - Select to view only non LEP students.
Radius - The radius of influence for each data point in pixels. this causes more points in the same vicinity, defined by pixels on the map, to overlap into the heat map.
Intensity - This intensity each data point carries in pixels. This causes the individual point to be brighter in the hear map overlay.
OK - Click to continue.
Clear - Click to clear out selection made.
Cancel - Click to close the setup box.
Attendance
Students will display heat spots representing dwelling population on the map based on the setup criteria based on Attendance.

Year - Defaults to the current year. A prior year may be accessed by clicking in the field and making the appropriate selection from the drop down list.
District - Default value is based on the user’s security settings. The user will be limited to their district only.
School - Default value is based on the user's security settings. If the user is assigned to a school, the school default value will be their school site code.
Grade - Leave blank or select all to include all grade levels. Otherwise, choose the desired grade level.
Attendance Code - The codes listed in this field will be skipped when counting the absences for the student.
Health Codes - Select the Health Codes to include in the results.
Date From and Date To - Select the date(s) range for attendance.
Count>= - Select the day(s) absent.
Radius - The radius of influence for each data point in pixels. this causes more points in the same vicinity, defined by pixels on the map, to overlap into the heat map.
Intensity - This intensity each data point carries in pixels. This causes the individual point to be brighter in the hear map overlay.
OK - Click to continue.
Clear - Click to clear out selection made.
Cancel - Click to close the setup box.
Attendance Zone
A map of the user`s district will be displayed based on the Attendance Zones drawn in the DMS System.

Year - Defaults to the current year. A prior year may be accessed by clicking in the field and making the appropriate selection from the drop down list.
District - Default value is based on the user’s security settings. The user will be limited to their district only.
School - Default value is based on the user's security settings. If the user is assigned to a school, the school default value will be their school site code.
OK - Click to continue.
Clear - Click to clear out selection made.
Cancel - Click to close the setup box.
Test Scores
Students will display heat spots representing dwelling population on the map based on the setup criteria and the student`s Test Scores.

Year - Defaults to the current year. A prior year may be accessed by clicking in the field and making the appropriate selection from the drop down list.
District - Default value is based on the user’s security settings. The user will be limited to their district only.
School - Default value is based on the user's security settings. If the user is assigned to a school, the school default value will be their school site code.
Grade - Leave blank or select all to include all grade levels. Otherwise, choose the desired grade level.
Test Name - Select the test standardized test.
Test Section - Select a subject
Test Score - Select the performance level - alternate, excellent, exempt, fair, good, growth, needs improvement and pending.
Test From Date and Test To Date - Select the date(s) range for test.
Radius - The radius of influence for each data point in pixels. this causes more points in the same vicinity, defined by pixels on the map, to overlap into the heat map.
Intensity - This intensity each data point carries in pixels. This causes the individual point to be brighter in the hear map overlay.
OK - Click to continue.
Clear - Click to clear out selection made.
Cancel - Click to close the setup box.
Grades
Students will display heat spots representing dwelling population on the map based on the setup criteria and the student`s grades.

Year - Defaults to the current year. A prior year may be accessed by clicking in the field and making the appropriate selection from the drop down list.
District - Default value is based on the user’s security settings. The user will be limited to their district only.
School - Default value is based on the user's security settings. If the user is assigned to a school, the school default value will be their school site code.
Grade - Leave blank or select all to include all grade levels. Otherwise, choose the desired grade level.
Course Name - Select the correct course to filter the outcome.
Marking Period - Select the marking period.
Grade Earned - Select the grade earned by the student(s).
Radius - The radius of influence for each data point in pixels. this causes more points in the same vicinity, defined by pixels on the map, to overlap into the heat map.
Intensity - This intensity each data point carries in pixels. This causes the individual point to be brighter in the hear map overlay.
OK - Click to continue.
Clear - Click to clear out selection made.
Cancel - Click to close the setup box.
GPA
Students will display heat spots representing dwelling population on the map based on the setup criteria and the student`s GPA.

Year - Defaults to the current year. A prior year may be accessed by clicking in the field and making the appropriate selection from the drop down list.
District - Default value is based on the user’s security settings. The user will be limited to their district only.
School - Default value is based on the user's security settings. If the user is assigned to a school, the school default value will be their school site code.
Grade - Leave blank or select all to include all grade levels. Otherwise, choose the desired grade level.
Marking Period - This will specify for which Marking Period the user wants the GPA.
GPA Print Type - Select Alpha Basic, Alpha Loaded, Alpha Raw, Numeric Basic and Numeric Loader.
Cumulative GPA On - Choose which column of grades to use for averaging if the cumulative GPA is needed. Ex: Grading Periods, Semesters, or Finals
Minimum GPA - Filter out students with a lower GPA of your choosing, then type that GPA in the box.
Maximum GPA - Filter out students with a higher GPA of your choosing, then type that GPA in the box.
Radius - The radius of influence for each data point in pixels. this causes more points in the same vicinity, defined by pixels on the map, to overlap into the heat map.
Intensity - This intensity each data point carries in pixels. This causes the individual point to be brighter in the hear map overlay.
OK - Click to continue.
Clear - Click to clear out selection made.
Cancel - Click to close the setup box.
Discipline
Students will display heat spots representing dwelling population on the map based on the setup criteria and the student`s Discipline.

Year - Defaults to the current year. A prior year may be accessed by clicking in the field and making the appropriate selection from the drop down list.
District - Default value is based on the user’s security settings. The user will be limited to their district only.
School - Default value is based on the user's security settings. If the user is assigned to a school, the school default value will be their school site code.
Grade - Leave blank or select all to include all grade levels. Otherwise, choose the desired grade level.
Bus Referral - If the box is checked it will only display bus referrals. If the box is not checked it will display all referrals.
Incident Codes - Select the referral incident code(s).
Admin Actions - Select the admin action code(s).
Incident Count >= - Select the number of referrals a student has.
Radius - The radius of influence for each data point in pixels. this causes more points in the same vicinity, defined by pixels on the map, to overlap into the heat map.
Intensity - This intensity each data point carries in pixels. This causes the individual point to be brighter in the hear map overlay.
OK - Click to continue.
Clear - Click to clear out selection made.
Cancel - Click to close the setup box.
To find definitions for standard setup values, follow this link: Standard Setup Options.
Sandbox Zones
When choosing Sandbox Zones, on the next popup box, if Live is chosen, the top border will be black. But if another zone is chosen (other than Live) the top border will be pink to show the user they are in Sandbox using the zone that is chosen. Here the user can use this for planning purposes without changing any information in LIVE data.

Health

Year - Defaults to the current year. A prior year may be accessed by clicking in the field and making the appropriate selection from the drop down list.
District - Default value is based on the user's security settings. It will be limited to the user's district only.
School - Default value is based on the user’s security settings. If the user is assigned to a school, the school default value will be their school site code.
Grade - Leave blank or select all to include all grades. Otherwise, choose the desired grade.
Age From - To - Choose desired age range of students.
Include Immunizations - Click inside the box for a list to choose from to include on the report.
Exclude Immunizations - Click inside the box for a list to choose from to exclude on the report.
Active Only - This choice will list only those students who are actively enrolled as of the date selected in the date field.
As Of Date - This choice will list only those students who are actively enrolled as of the date selected in the date field.
Radius - The radius influence for each data point in pixels. This caused more points in the same vicinity defined by pixels on the map, to overlap into the heat map.
Intensity - The intensity each data point carries in pixels. This causes the individual point to be brighter, and more points to be brighter in the heat map overlay.
Ok - Click to continue.
Clear - Click to clear the screen to begin entering new site information.
Cancel - Click to cancel.
Settings

Show Absences - This must be check for the absences to show on the report.
Skip Codes - Click inside the box to choose absence codes.
Date From-Date To - A set of dates that limits the selection of records for the report to a beginning date (from) and an ending date (to) range.