Attendance Trends Graphing
Video How-to
Attendance Trends Graphing video
How-to
This program will let you to view student's attendance graphically based on a specific date range. There are three graph types: Bar Graph, Pie Graph, and Line Graph.
Menu Location
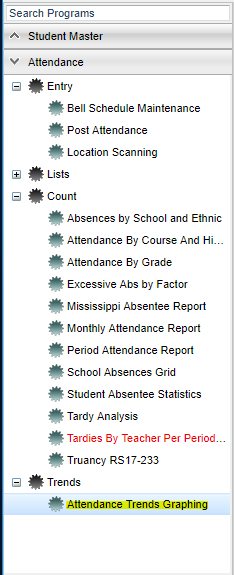
On the left navigation panel, select Attendance > Trends' > Attendance Trends Graphing
Setup Options
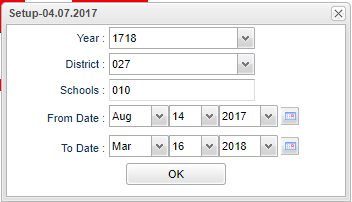
Year - Defaults to the current year. A prior year may be accessed by clicking in the field and making the appropriate selection from the drop down list.
District - Default value is based on your security settings. You will be limited to your district only.
School - Default value is based on your security settings. If you are assigned to a school, the school default value will be your school site code. You will not be able to change this
value. If you are a supervisor or other district office employee with access to the Student Information System, you will be able to run programs for one school, a small group of schools, or
all schools in your district.
From Date and To Date - A set of dates that limits the selection of records for the report to a beginning date (from) and an ending date (to) range.
Ok - Click to continue
To find definitions for standard setup values, follow this link: Standard Setup Options.
Main
Column Headers
For other columns not listed in the common column list:
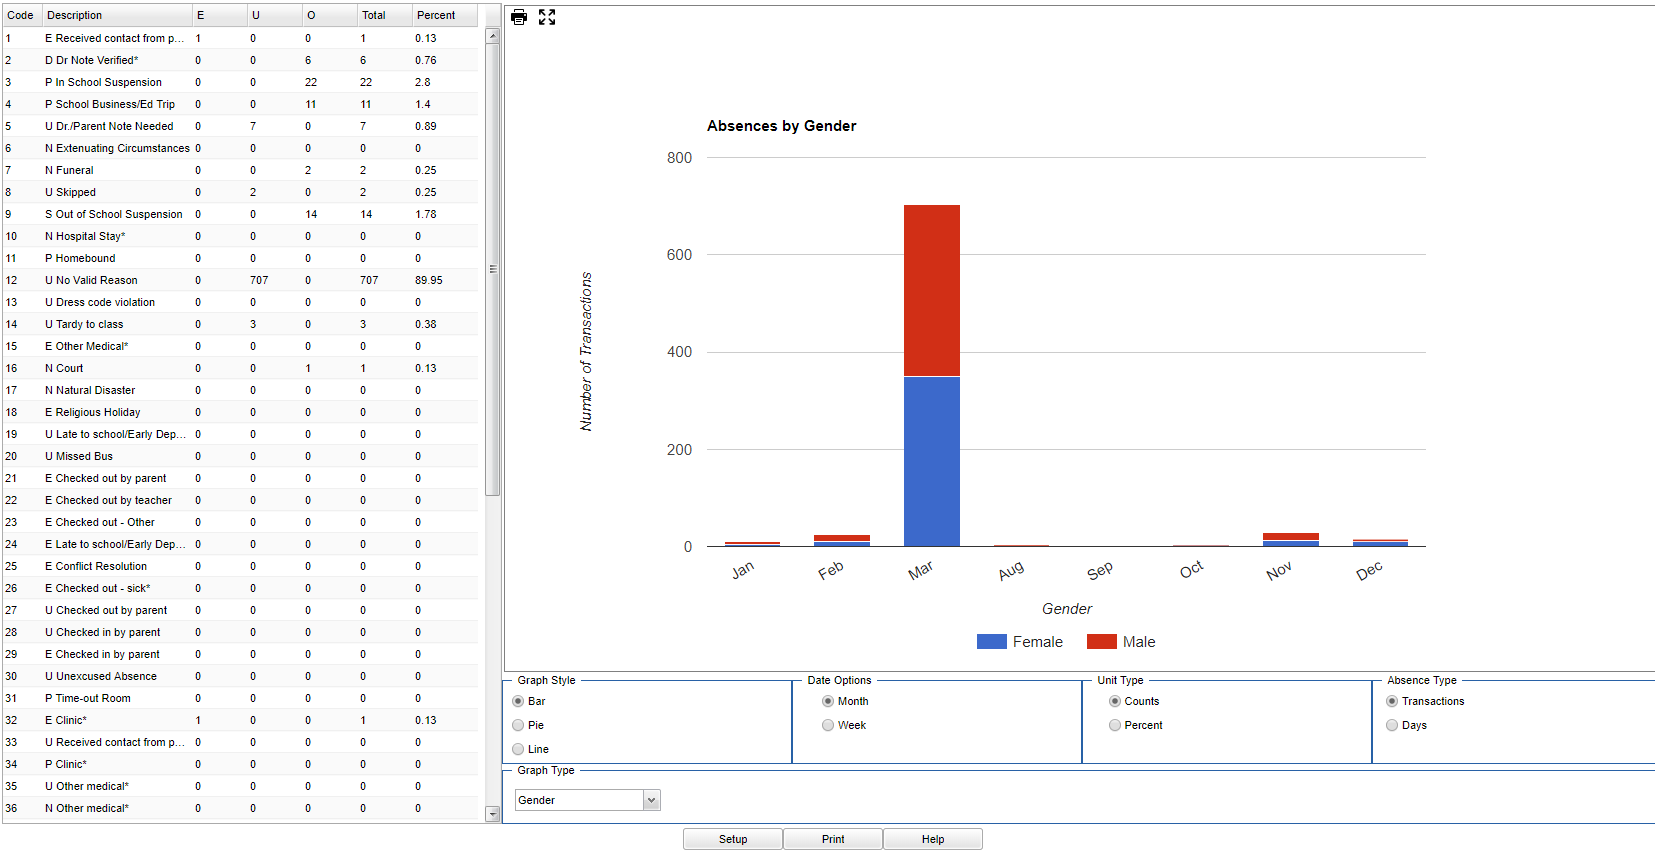
- Codes – The number associated with the attendance code for posting attendance.
- Description – A description that corresponds with the code number.
- E – Total number of Excused absences recorded for the selected date range.
- U – Total number of Unexcused absences recorded for the selected date range.
- O – Total number of Late arrival/early departure check in/out days from school and/or any tardies which are categorized as Other
- Total – Total number of students with this particular absence code
- Percent – Percentage of the total number of students with this particular absence code
Graph Options
- Graph Style – You may choose a Bar Graph (Number of transactions), Pie Graph (Pie Shape), or a Line Graph (Range Axis).
- Date Option – Review results by the Month or by the Week
- Unit Type – Counts (Number of Transactions) or Percent (Percentage of Transactions)
- Absence Type – Transactions (Number of transactions) or Days (Number of Days)
- Graph Type
- Gender
- Ethnicity
- Special Education
- Grade
- Time Span in number of days
- Site--School Site
- Time of Day - Hour of the day
- Day of Week
- 3 Year - gives data for a 3 Year Span using the same date span
To find definitions of commonly used column headers, follow this link: Common Column Headers.
To Print
- There are two options for printing
- Printing the chart
- Printing the graph
- To print the chart
- Click the print button at the bottom of the screen.
- A popup will appear with several print versions available. The PDF version is the default and is preferred.
- Click the Print button at the bottom of this popup and a print preview will appear on the left of the screen.
- A printer icon will appear at the bottom of the preview. Click the printer icon.
- Then click the printer button at the top of the preview.
- After the chart prints, close the print preview window.
- To print the graph
- Above the 'Graph Style selection' there is a small printer icon. Click this icon to get a preview of the graph.
- This preview will appear on the left of the screen.
- Another printer icon will appear at the bottom of the preview. Click this printer icon.
- Click the printer button at the top of the preview.
- After the graph prints, close the print preview window.


