IEP Participants
This program contains a table of the number and percentage of participants in the IEP process. The report is broken down by school site and the type of the IEP participant.
Menu Location
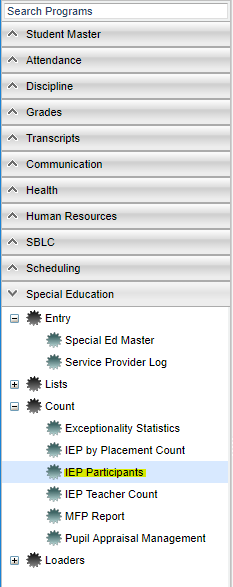
On the left navigation panel, select Special Education > Count > IEP Participants.
Setup Options
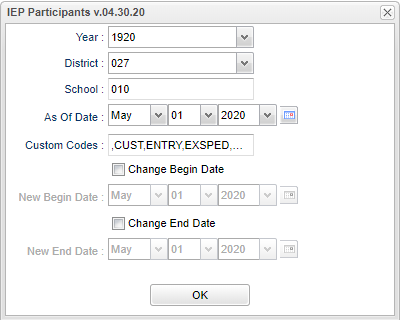
Year - Defaults to the current year. A prior year may be accessed by clicking in the field and making the appropriate selection from the drop down list.
District - Default value is based on the user's security settings. It will be limited to the user's district only.
School - Default value is based on the user's security settings. If the user is assigned to a school, the school default value will be the user's school site code.
As of Date - This choice will list only those students who are actively enrolled as of the date selected in the date field.
Custom Codes - Select the Custom Codes created in the Custom Codes Managemement to filter the student list.
Change Begin Date - Place a check to un-gray the option to set a new begin date. Otherwise, it defaults to the current date.
Change End Date - Place a check to un-gray the optoin to set a new end date. Otherwise, it defaults to the current date.
OK - Click to continue.
To find definitions for standard setup values, follow this link: Standard Setup Options.
Main
Column Headers
School - Student's school of enrollment
Count Code 1 - Count of ODR IEP participants
% of 1 - Percentage of ODR IEP participants
Count Code 2 - Count of regular education teacher IEP participants
% of 2 - Percentage of regular education teacher IEP participants
Count Code 3 - Count of special education teacher IEP participants
% of 3 - Percentage of special education teacher IEP participants
Count Code 4 - Count of parent/guardian IEP participants
% of 4 - Percentage of parent/guardian IEP participants
Count Code 5 - Count of student IEP participants
% of 5 - Percentage of student IEP participants
Count Code 6 - Count of PA rep IEP participants
% of 6 - Percentage of PA rep IEP participants
Count Code 7 - Count of Related Services Per. IEP participants
% of 7 - Percentage of Related Services Per. IEP participants
Count Code 8 - Count of Interpreter IEP participants
% of 8 - Percentage of Interpreter IEP participants
Count Code 9 - Count of Other IEP participants
% of 9 - Percentage of Other IEP participants
Total IEPs Done - The total number of IEPs processed. Click on the number to see a roster of the students and more IEP information per student.
To find definitions of commonly used column headers, follow this link: Common Column Headers.
Bottom
Setup - Click to go back to the Setup box.
Print - This will allow the user to print the report.
Help - Click to view written instructions and/or videos.


