Grade Distribution Report
Display Grade Counts by Totals and Percentage.
Video
Grade Distribution Report video
Menu Location
Grades > Count > Grade Distribution Report
Setup Options
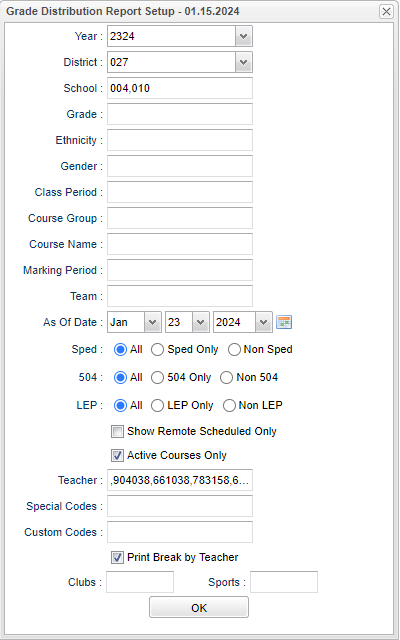
Year - Defaults to the current year. A prior year may be accessed by clicking in the field and making the appropriate selection from the drop down list.
District - Default value is based on the user's security settings. It will be limited to their district only.
School - Default value is based on the user's security settings. If the user is assigned to a school, the school default value will be their school site code.
Grade - Leave blank or select all to include all grade levels. Otherwise, choose the desired grade level.
Ethnic - Leave blank or select all to include all ethnicities. Otherwise, choose the desired ethnic.
Gender - Leave blank or select all to include both genders. Otherwise, choose the desired gender.
Class Period - Select the class period
Course Name - Should be left blank if all courses are to be included in the report. The course list is from the Courses Catalog. Otherwise, click in the field to get a list of courses. You may check one or more courses for the report.
Course Group - Should be left blank if all courses types are to be included in the report. If the user wishes to limit the report to just courses in a transcript group(s), click to select the desired course groups.
- Example: To limit report to just courses categorized as English and Math, click and select "English" and "Math". The resulting report will only show counts for classes categorized as "English" and "Math" of courses.
- If you click the check box to the left of "value" then all groups will be checked.
Marking Period - Select the marking period
Team - This selection should only be used if your school is using Team Scheduling. Leave blank if all team names are to be included into the report. Otherwise click in the field to the right of Teams to select the desired Teams(s) to view.
As-of-Date - This choice will list only those students who are actively enrolled as of the date selected in the date field.
Sped: All - Select this to show all students. Sped Only - Select this to show Sped only students. Non Sped - Select this to show Non Sped students
504: All - Select this to show all students. 504 Only - Select this to show 504 only students. Non 504 - Select this to show Non 504 students.
LEP: All - Select this to show all students. LEP Only - Select this to show LEP only students. Non LEP - Select this to show Non LEP students.
Show Option Buttons - Examples that limit information on the report include Show Sped Only, Non Sped, both (all)
Remote Scheduled Students Only This option will limit your report to show grades distribution only for students that are scheduled into remote classes.
Active Courses Only option will limit the counts to students that currently have the specified course scheduled.
Teacher - This option will let you choose a teacher(s)
Special Codes Leave blank if all special codes are to be included in the report. Otherwise, choose a desired special code.
Custom Codes - Select Custom Codes created in the Custom Codes Management to filter the student list.
Print Break by Teacher - Click the box to print break by teacher.
Clubs - Leave blank if all clubs are to be included in the report. Otherwise, choose a desired club code.
Sports - Leave blank if all sport codes are to be included in the report. Otherwise, choose a desired sport code.
OK - Click to continue
- Note - If a class is not displayed, it is because there are no grades posted for the course.
To find definitions for standard setup values, follow this link: Standard Setup Options.
Main
Column Headers
Sch - School site number
Teacher - Teacher name
Period - Period number
Course - Course name
TGR - Total grades posted.
Column Headers A, A%, through F, F% - Count of students with an A, B, etc., followed by the percent of each.
Column Headers P, P% - Number of students earning a grade of P followed by the percent.
Column Header O, O% through U, U% - Number of students earning a grades of O, S, N, U followed by the percent of each.
Column Header I, I% - Number of students with an incomplete followed by the percent.
Column OT - The number of students with grades other than those in previous columns.
Column QP - The total quality points divided by the total grades posted.
Column NUM - Total numeric points divided by total grades posted.
Column Grade - Grading scale letter equivalent of the NUM column. This field will be empty if a mix of grading scales are used.
To find definitions of commonly used column headers, follow this link: Common Column Headers.
Count Cell Click Applications
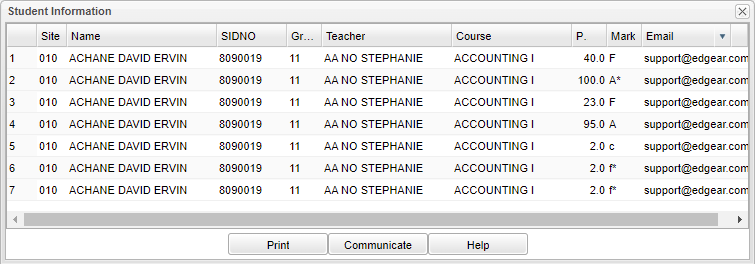
TIP: If the user clicks on the number in the grades count cell, the roster of students who have that grade will be displayed on the screen.
- To obtain a quick list of students failing a single course: Click on the count of "F" grades for a single course.
- To obtain a quick list of students failing all classes taught by a teacher: On the teacher summary row, click on the count of "F" grades.
- To obtain a quick list of students failing all classes in the report: Browse to the very last row of the report labeled "Grade". Click on the count of "F" grades to get a list of all students failing all classes on the report.
- To obtain the teacher's absence report and referral incident list: Click on the teacher's name.
Bottom
Setup - Click to go back to the Setup box.
Print - This will allow the user to print the report.
Help - Click to view written instructions and/or videos.


