Difference between revisions of "RTI Tier/Cat Trends"
| Line 9: | Line 9: | ||
==Setup Options== | ==Setup Options== | ||
| − | |||
[[File:popcorn2.png]] | [[File:popcorn2.png]] | ||
| Line 35: | Line 34: | ||
==Main== | ==Main== | ||
| + | [[File:popcorn4.png]] | ||
[[File:popcorn3.png]] | [[File:popcorn3.png]] | ||
Revision as of 09:30, 5 March 2018
This program will provide counts and graphing of RTI Tier/Category/Interventions in schools.
Menu Location
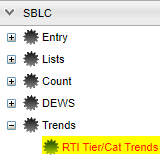
On the left navigation panel select SBLC > Trends > RTI Tier/Cat Trends.
Setup Options
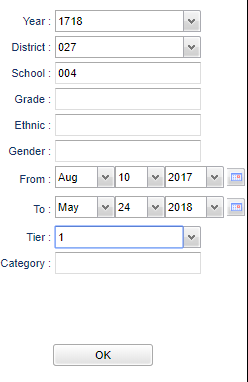
Year - Defaults to the current year. A prior year may be accessed by clicking in the field and making the appropriate selection from the drop down list.
District - Default value is based on your security settings. You will be limited to your district only.
School - Default value is based on your security settings. If you are assigned to a school, the school default value will be your school site code. You will not be able to change this value. If you are a supervisor or other district office employee with access to the Student Information System, you will be able to run programs for one school, a small group of schools, or all schools in your district.
Grade - Grade level of students whose names are to be included on a report. Leave the field blank if all grade levels are to be included. Otherwise, click in the field to the right of Grade(s) to select the desired grade level(s) to be included.
Ethnic - Ethnicity of students whose names are to be included on a report. Leave the field blank if all ethnics are to be included. Otherwise, click in the field to the right of Ethnic to select the desired ethnic(s) to be included.
Gender - Gender of students whose names are to be included on a report. Leave the field blank if both genders are to be included. Otherwise, click in the field to the right of Gender to select the desired gender to be included.
From Date and To Date - A set of dates that limits the selection of records for the report to a beginning date (from) and an ending date (to) range.
Tier - Choose tier 1, 2 or 3 as indicated from the Tier box in the SBLC/RTI Editor.
Category - Choose the category as indicated from the Category box in the SBLC/RTI Editor.
To find definitions for standard setup values, follow this link: Standard Setup Options.
OK - Click to continue.
Main
Top
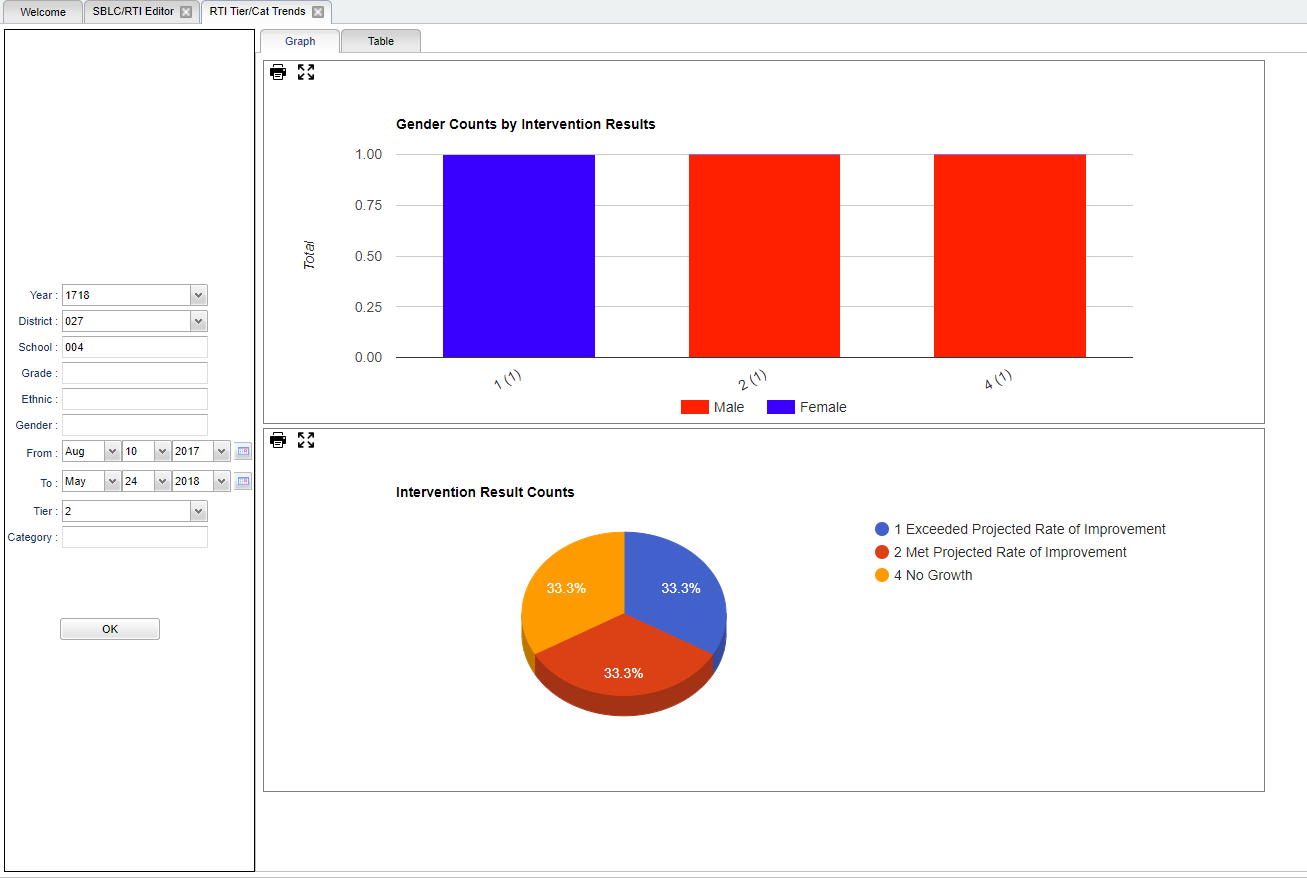
On the Graph tab, the bar graph shows the gender counts by intervention results. The first number, under the bar, is the intervention result. The number in the parenthesis is a student count.
The pie chart shows the intervention result counts as identified on the right of the pie chart. This information comes from the Result box in the SBLC/RTI Editor.
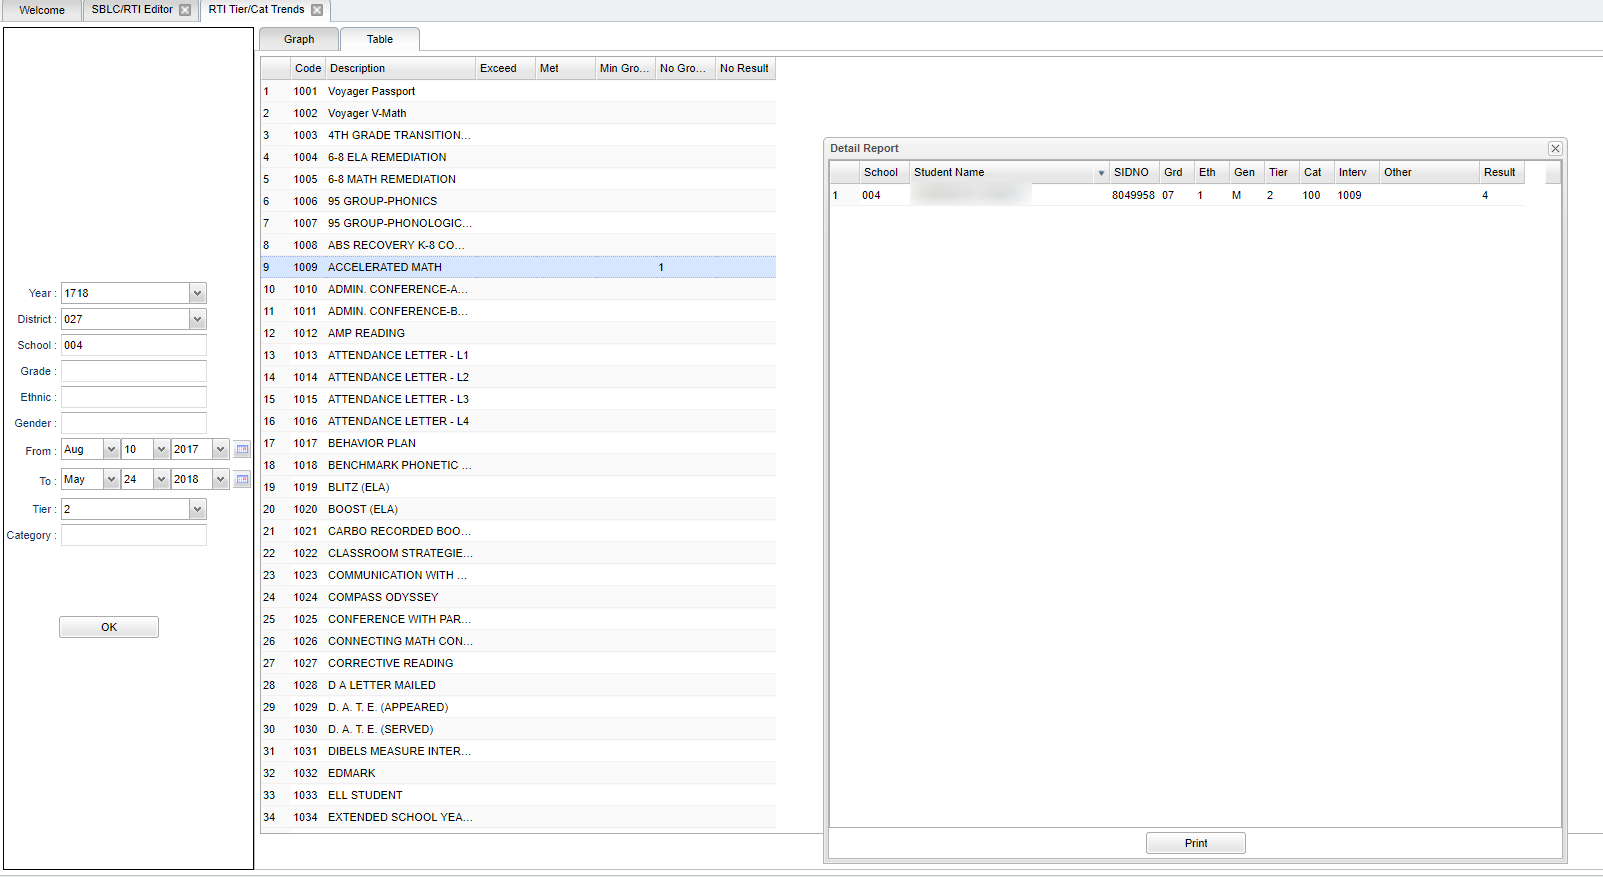
On the Table tab,
Column Headers
To find definitions of commonly used column headers, follow this link: Common Column Headers.
Bottom
Print - To find the print instructions, follow this link: Standard Print Options.


