Difference between revisions of "Curriculum Monitor"
| Line 26: | Line 26: | ||
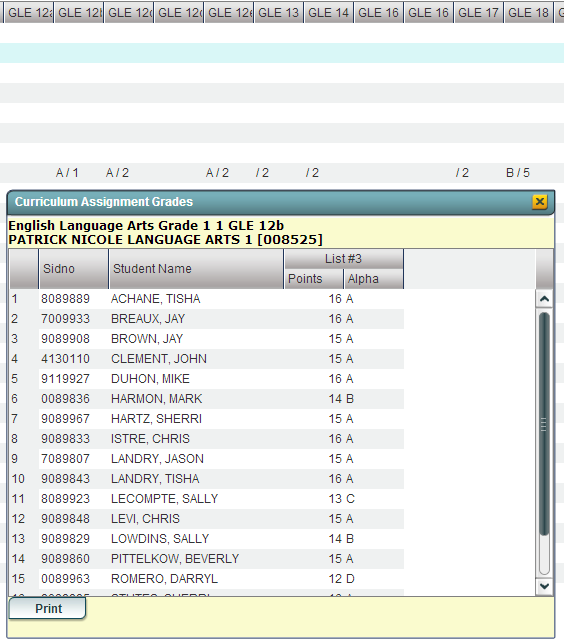
| − | Click on the data in the GLE # columns to see the curriculum assignment grades in detail. For example, under column 12b, the A is the average grade for this assignment and the 1 indicates there was one assignment for this GLE. | + | Click on the data in the GLE # columns to see the curriculum assignment grades in detail. For example, under column 12b for the assignment List #3, the A is the average grade for this assignment and the 1 indicates there was one assignment for this GLE. |
[[File:CurMon.PNG]] | [[File:CurMon.PNG]] | ||
Revision as of 05:15, 26 June 2014
This report will analyze classes per GLE status. It will help to show how GLE standards are being used in assignments and the grades produced from them.
- On the left, click on Grades.
- Under Lists, select Curriculum Monitor
- If you need instructions for setup values to be used, follow the link for Standard Setup Options.
The next items are not found on the Standard Setup Options document.
- Content Areas - choose between English Language Arts, Math, Social Studies or Science
- Curriculum Manual- choose the level of the Content Area that you previously chose
- Curriculum Unit - choose the unit of the Curriculum Manual that you previously chose
Definitions of Column Headers
To find definitions of commonly used columns follow this link: Common Column Headers.
The next items are not found on the Common Column Headers document.
- Avg - section's overall average
- GLE # - hovering over these column headers will indicate the grade level expectations
- Other - unassigned or unknown GLEs
Click on the data in the GLE # columns to see the curriculum assignment grades in detail. For example, under column 12b for the assignment List #3, the A is the average grade for this assignment and the 1 indicates there was one assignment for this GLE.
To Print the List
- Click the Print button at the bottom of the screen.
- A print preview window will appear.
- To get the print icon on this window, hover the mouse in the bottom right area of the preview. A grey rectangle will appear with several icons.
- Click the print icon at the right end of this rectangle. Another print preview will appear.
- Click the print button at the top left to print the report. Close the print preview.
Sorting and other data manipulations are explained in the following link: List Programs Instructions/Video
