Difference between revisions of "Dashboard tab"
(→Top) |
|||
| Line 26: | Line 26: | ||
[[File:Clear_Filters.png]] - If multiple graphs are on a page, a user can click on a segment of one graph to filter all other graphs. Clear Filters will reset all graphs back to normal. | [[File:Clear_Filters.png]] - If multiple graphs are on a page, a user can click on a segment of one graph to filter all other graphs. Clear Filters will reset all graphs back to normal. | ||
| − | [[ | + | [[Image:Filter_All_Graphs_On_Dashboard_Page.png |link=Filter All Graphs On Dashboard Page]] - The user can set parameters for the graphs on the page. Once the user clicks ok on the setup box, all the graphs will update based on the selected settings. |
| + | |||
| + | |||
[[File:Remove_Dashboard_Page.png]] - Click on the trash can to delete the dashboard page. | [[File:Remove_Dashboard_Page.png]] - Click on the trash can to delete the dashboard page. | ||
Revision as of 09:52, 15 July 2019
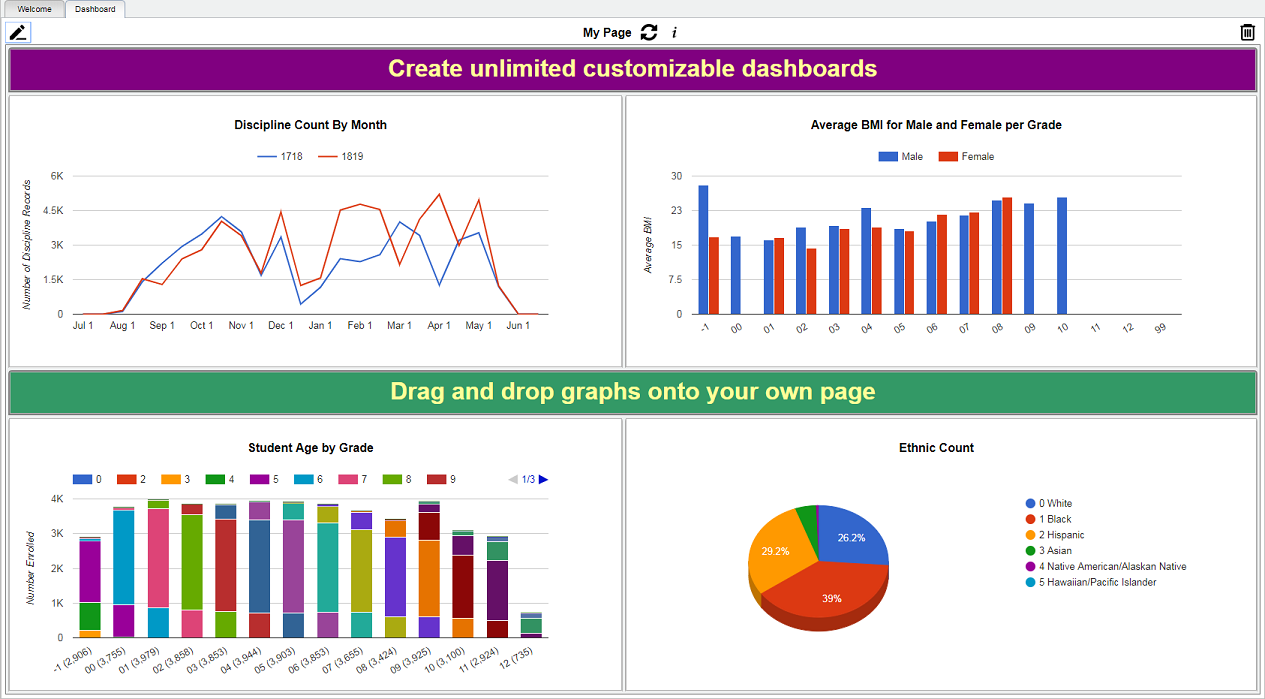
This program will allow the user to create dashboards and add graphs related to students demographics, attendance, discipline, health and communication.
- Principals and 700 users will see the tab by default, but will need to have security set to use the program.
- Other non-teacher users will need to be given security access before they see the tab. Teachers, TE profile, cannot be given access. They will use this program in their Classroom program with Classroom security.
- In User Management, select Dashboard from the Category area. From there, additional permissions are available as well.
Main
Top
From left to right, these are the icons used to setup dashboard page(s).
![]()
![]() - Select to either enter view mode or enter edit mode.
- Select to either enter view mode or enter edit mode.
![]() - By clicking on the toggle menu dock, the user can select what area of graphs they would like to view. Click here to see Available Graphs.
- By clicking on the toggle menu dock, the user can select what area of graphs they would like to view. Click here to see Available Graphs.
![]() - A user can click this button to add headers to each section or graphs to help organize the graphs on the Dashboard.
- A user can click this button to add headers to each section or graphs to help organize the graphs on the Dashboard.
![]() - A user can have more than one dashboard page. Therefore, the user can click on the name of the page to view a list of pages they have created.
- A user can have more than one dashboard page. Therefore, the user can click on the name of the page to view a list of pages they have created.
![]() - If multiple graphs are on a page, a user can click on a segment of one graph to filter all other graphs. Clear Filters will reset all graphs back to normal.
- If multiple graphs are on a page, a user can click on a segment of one graph to filter all other graphs. Clear Filters will reset all graphs back to normal.
![]() - The user can set parameters for the graphs on the page. Once the user clicks ok on the setup box, all the graphs will update based on the selected settings.
- The user can set parameters for the graphs on the page. Once the user clicks ok on the setup box, all the graphs will update based on the selected settings.
![]() - Click on the trash can to delete the dashboard page.
- Click on the trash can to delete the dashboard page.
How-to
