Difference between revisions of "DMS Maps"
From EDgearWiki
Jump to navigationJump to search| Line 12: | Line 12: | ||
#*'''Intensity''' determines how bright the heat spots are. The lower the number the brighter. | #*'''Intensity''' determines how bright the heat spots are. The lower the number the brighter. | ||
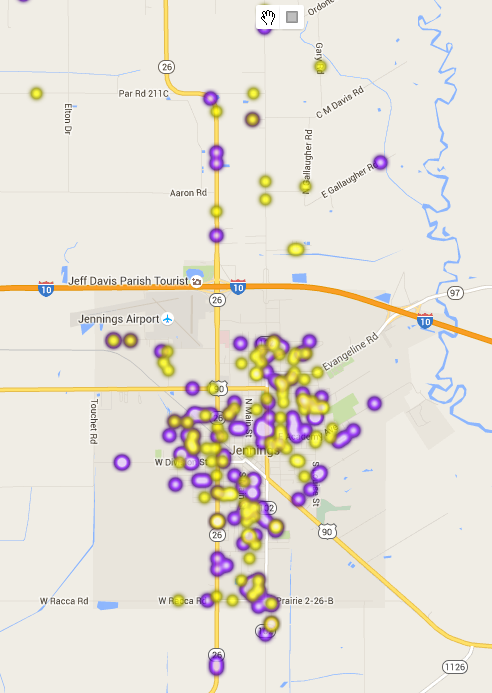
#Click '''OK'''<p>[[File:Heat_Map_1.png]]</p> | #Click '''OK'''<p>[[File:Heat_Map_1.png]]</p> | ||
| − | #Click on the Action menu and select Students again with different setup options to display a new set of heat spots along with the first set. | + | #Click on the Action menu and select Students again with different setup options to display a new set of heat spots along with the first set. <p>[[File:Heat_Map_2.png]]</p> |
Revision as of 14:53, 12 March 2016
This program will display a heat map based on options selected for student enrollment and attendance.
Upon entering the program, a map of the users district will be displayed based on the attendance zones drawn in the DMS System.
- Click on the Action menu.
- Click on Students.
- Students will display heat spots on the map based on the setup criteria and the student`s physical address.
- To find definitions for standard setup values, follow this link: Standard Setup Options. For other set up values not listed in the standard set up list:
- Select the Entry Codes and/or Leave Codes of the students to display on the map.
- For Radius, enter the number of pixels to be displayed for a heat spot for an individual student. The higher the number, the larger the spot will be on the map. As defined by Google, Radius is the radius of influence for each data point, in pixels.
- Intensity determines how bright the heat spots are. The lower the number the brighter.
- Click OK
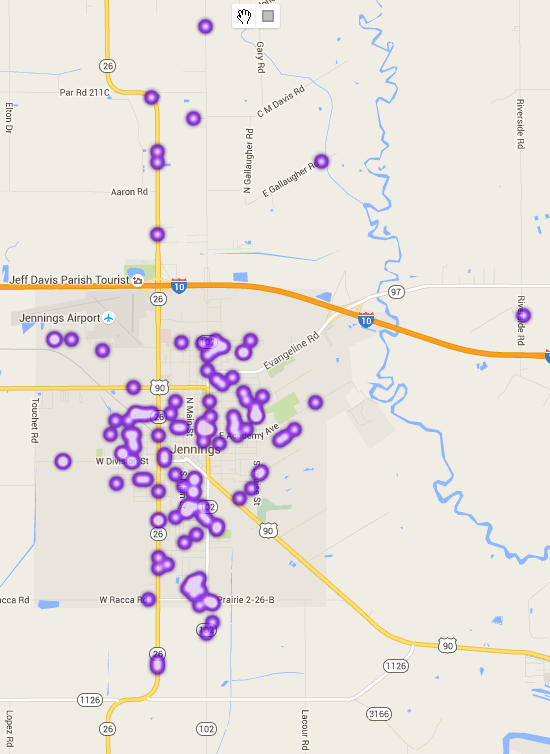
- Click on the Action menu and select Students again with different setup options to display a new set of heat spots along with the first set.