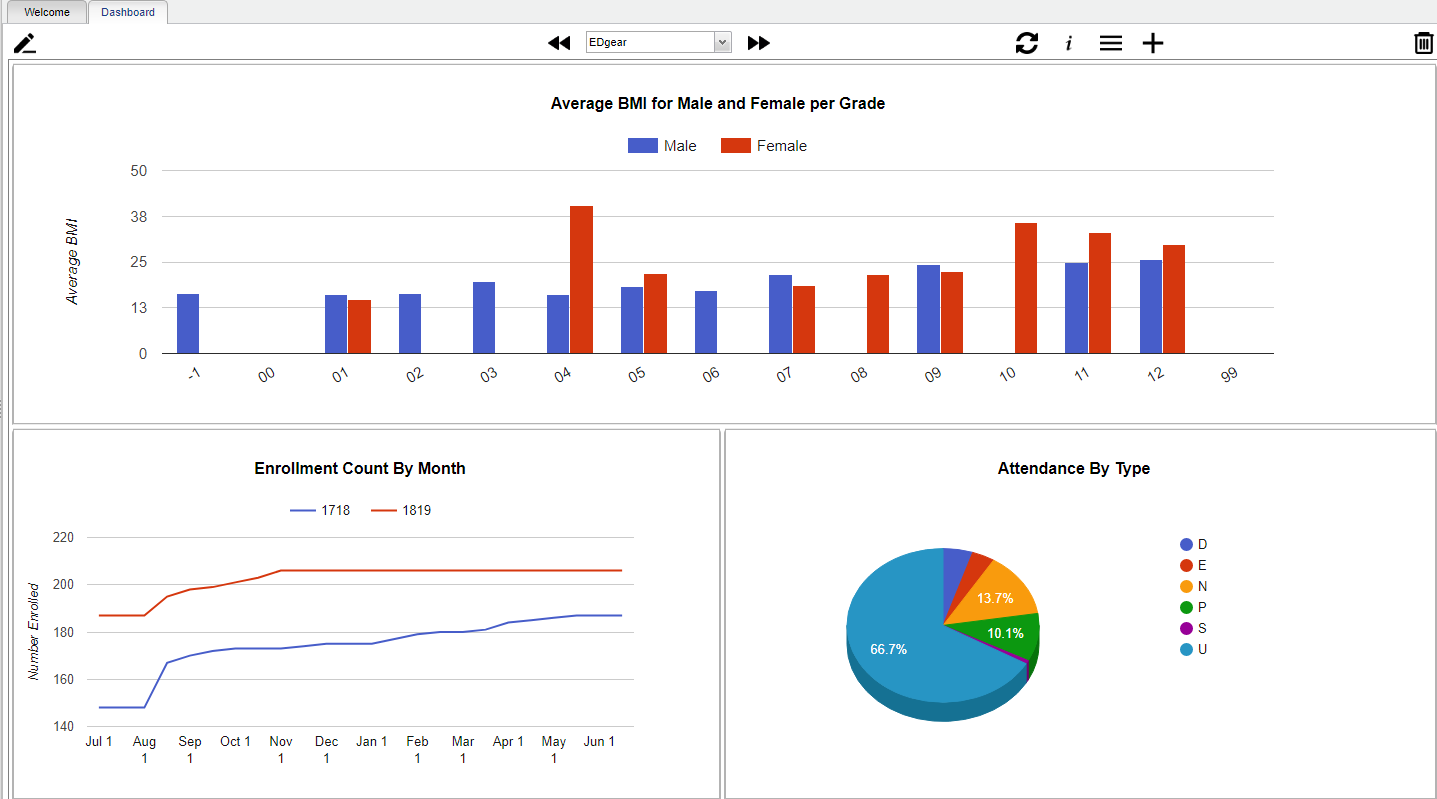
Dashboard tab
Menu Location
Main
Top
From left to right, these are the icons used to setup dashboard(s).
Enter View Mode/Enter Edit Mode - Select to either enter view mode or enter edit mode. ![]()
![]()
Toggle Menu Dock - By clicking on the toggle menu dock, the user can select what area of graphs they would like to view. Click here to see Available Graphs. ![]()
Dashboard Page View - A user can have more that one view of dashboards. Therefor, the user can use previous and next to see additional graphs. ![]()
Clear Filters - By clicking on clear filters, the user can remove any filters they have set.
Filter All Graphs On Dashboards - The user can set perimeters for they type of graphs they are wanting to view. The dashboard will provide data based on these settings.
Dashboard Settings - The users name will appear in the box. If user checks the Favorite box and clicks save, their dashboard will appear a default.
Add Dashboard - To add a dashboard page, name the dashboard in the text box and select add.
Remove Dashboard - Click on the trash can to delete the dashboards.

