Difference between revisions of "Summary"
From EDgearWiki
Jump to navigationJump to search| (2 intermediate revisions by the same user not shown) | |||
| Line 1: | Line 1: | ||
| − | '''This option gathers approximate student counts by month/by tier | + | '''This option gathers approximate student counts by month/by tier. The number counts can be clicked on to see a student list. Now the user can report the projected student counts based on the projected rules. This does look at absent codes, program codes, and virtual days in bells.''' |
[[File:summary chart.png]] | [[File:summary chart.png]] | ||
| + | |||
| + | '''Month''' - This is the Month and Year. | ||
| + | |||
| + | '''Tier 1''' - Total number of students with 1-5 Quarantine/At Home Learning Days. | ||
| + | |||
| + | '''Tier 2''' - Total number of students with 6-15 Quarantine/At Home Learning Days. | ||
| + | |||
| + | '''Tier 3''' - Total number of students with 16 or more Quarantine/At Home Learning Days. | ||
Latest revision as of 09:55, 1 February 2022
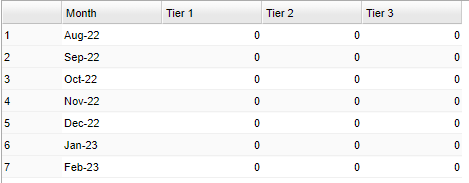
This option gathers approximate student counts by month/by tier. The number counts can be clicked on to see a student list. Now the user can report the projected student counts based on the projected rules. This does look at absent codes, program codes, and virtual days in bells.
Month - This is the Month and Year.
Tier 1 - Total number of students with 1-5 Quarantine/At Home Learning Days.
Tier 2 - Total number of students with 6-15 Quarantine/At Home Learning Days.
Tier 3 - Total number of students with 16 or more Quarantine/At Home Learning Days.
