Difference between revisions of "Creating Dashboards"
From EDgearWiki
Jump to navigationJump to search| (65 intermediate revisions by the same user not shown) | |||
| Line 1: | Line 1: | ||
| − | + | To get started, the user will first need to create their dashboard page by giving it a name. | |
| − | + | #Click on the [[File:wscreen.png]] located on the top of the menu bar, and a popup box will appear.<p>[[File:wscreen1.png]] | |
| + | #*Click on the '''Add''' button and then type in the name of the Dashboard in the '''Name''' field (i.e. At A Glance, Attendance, the user's name). | ||
| + | #*Once the name has been added, the user can click on the newly added name to navigate to the Dashboard. | ||
| + | #*Check the '''D''' field to '''default''' the Dashboard. Note that if a shared Dashboard exists and is set by the sharer as default, no changes will show. | ||
| + | #*Check the '''S''' field to '''share''' the Dashboard with others. Choose the staff to share with in the '''Staff Find One Box''' that appears. | ||
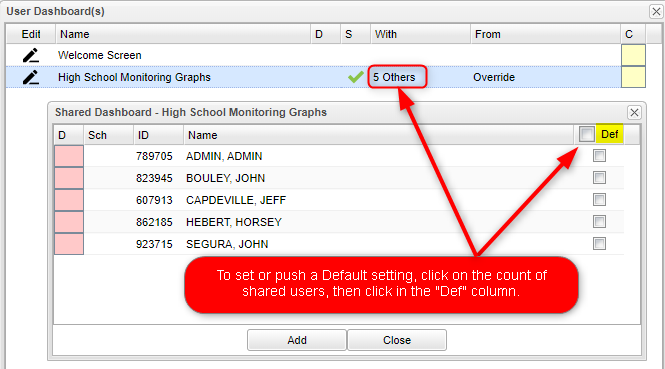
| + | #**If you wish to set (push) the shared dashboard as a '''default''' for the users, click on the count of shared users. | ||
| + | #**A listing of the users will appear. On the far right will be a column labeled "Def" (Default). Click to either select all of the users, or individually select the users to assign the dashboard as the default.[[File:SetDefaults.png]] | ||
| + | #*The '''With''' column will show a count of with whom the Dashboard was shared. | ||
| + | #*The '''From''' column will show the name of the user who is sharing the Dashboard. | ||
| + | #*The '''[[C]]''' column will allow the user to [[C | copy]] the Dashboard. | ||
| + | #*To add an additional dashboard pages, the user will simply repeat the process. | ||
| + | #Click on the pencil [[File:Enter_Edit_Mode.png]] located on the top left corner of the menu bar, and an icon will appear next to it. This is called the Toggle Menu Dock [[File:Toggle_Menu_Dock.png]]. | ||
| + | #*Click on the Toggle Menu Dock [[File:Toggle_Menu_Dock.png]] and a popup box will appear at the bottom center of the page. | ||
| + | #*Click on the drop down to select the area to view available graphs. The user can select which graph they would like to view. | ||
| + | #*Click on the graph, then drag and drop the graph to the area close to the purple line on the page to view. Each row will accommodate up to three graphs. The number of graphs per dashboard page is unlimited. | ||
| + | #*To remove the Toggle Menu Dock [[File:Toggle_Menu_Dock.png]], click on the icon again. | ||
| + | #Click on the [[File:i.png]] at the top of the page to get a setup box to be able to adjust the settings for all graphs on the dashboard page. | ||
| − | + | ===Removing Dashboards=== | |
| + | #To remove a graph, click in the top right corner of the graph. | ||
| + | #The user will the see a popup box that will ask the user if they want to delete the graph, Ok or cancel. | ||
| + | #To remove the dashboard, click on the trash can in the top right corner of the page. The user will then see a popup box that will ask the user if they are sure they want to delete the dashboard, yes or no. | ||
| − | |||
| − | |||
| − | + | [[Dashboard tab | '''Dashboard tab''' Main Page]] | |
Latest revision as of 08:30, 19 August 2021
To get started, the user will first need to create their dashboard page by giving it a name.
- Click on the
 located on the top of the menu bar, and a popup box will appear.
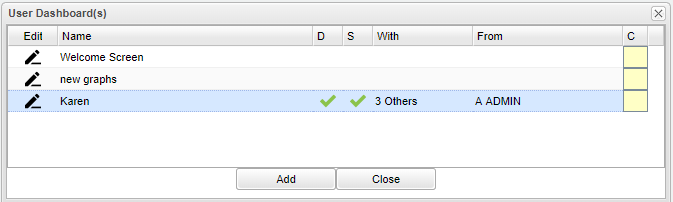
- Click on the Add button and then type in the name of the Dashboard in the Name field (i.e. At A Glance, Attendance, the user's name).
- Once the name has been added, the user can click on the newly added name to navigate to the Dashboard.
- Check the D field to default the Dashboard. Note that if a shared Dashboard exists and is set by the sharer as default, no changes will show.
- Check the S field to share the Dashboard with others. Choose the staff to share with in the Staff Find One Box that appears.
- If you wish to set (push) the shared dashboard as a default for the users, click on the count of shared users.
- A listing of the users will appear. On the far right will be a column labeled "Def" (Default). Click to either select all of the users, or individually select the users to assign the dashboard as the default.
- The With column will show a count of with whom the Dashboard was shared.
- The From column will show the name of the user who is sharing the Dashboard.
- The C column will allow the user to copy the Dashboard.
- To add an additional dashboard pages, the user will simply repeat the process.
- Click on the pencil
 located on the top left corner of the menu bar, and an icon will appear next to it. This is called the Toggle Menu Dock
  .
.
- Click on the Toggle Menu Dock and a popup box will appear at the bottom center of the page.
- Click on the drop down to select the area to view available graphs. The user can select which graph they would like to view.
- Click on the graph, then drag and drop the graph to the area close to the purple line on the page to view. Each row will accommodate up to three graphs. The number of graphs per dashboard page is unlimited.
- To remove the Toggle Menu Dock , click on the icon again.
- Click on the Toggle Menu Dock
- Click on the
 at the top of the page to get a setup box to be able to adjust the settings for all graphs on the dashboard page.


Removing Dashboards
- To remove a graph, click in the top right corner of the graph.
- The user will the see a popup box that will ask the user if they want to delete the graph, Ok or cancel.
- To remove the dashboard, click on the trash can in the top right corner of the page. The user will then see a popup box that will ask the user if they are sure they want to delete the dashboard, yes or no.